The Multithreaded Service Dispatcher maintains statistics for connections made to services controlled by the Dispatcher.
For each connection the Dispatcher receives, it retains information about the connection including connection times, and source and destination IP addresses. The Dispatcher statistics module uses this information to build more comprehensive statistics. For each Worker Process, the Dispatcher maintains statistics on the current, peak (simultaneous), and total number of connections handled by that process. It also tracks the starting and ending time for each process.
On a "higher" level, the Dispatcher also maintains statistics (including the minimum, average, and maximum) on a per-service basis for the number of concurrent connections, the number of connections received per hour, and the durations of the connections received.
These statistics are viewable with any web browser that supports use of tables.
To support viewing the statistics, note that the PMDF HTTP server must
be configured to serve out the Dispatcher statistics, and access to the
PMDF HTTP server must be enabled. If you have used the web-based
PMDF-MTA configuration utility or if you have used the command line
Dispatcher configuration utility, PMDF CONFIGURE DISPATCHER (OpenVMS)
or pmdf configure dispatcher (UNIX), then you will already
have a suitable HTTP server configuration. These configuration
utilities as of PMDF V6.0 will also have generated an HTTP_ACCESS
mapping table that allows access only to systems and subnets listed by
you as "internal during the configuration". But if you are
running with a configuration generated in an older version of PMDF and
if you have not already enabled access to the PMDF Service Dispatcher
statistics, then you will need to enable such access by adding to the
PMDF mapping file an HTTP_ACCESS mapping table with entries such as:
HTTP_ACCESS

  127.0.0.1|*|*|*|GET|/dispatcher/*     $Y
  *|*|*|*|GET|/dispatcher/*             $N
  *|*|*|*|*|*                           $N
The last entry shown is disabling access to all other HTTP server services.
Once the PMDF Service Dispatcher and PMDF HTTP server are configured, access to the Dispatcher statistics has been enabled, and the Dispatcher has been started, you can view the Dispatcher statistics by accessing the URL:
http://hostname:7633/dispatcher/where
hostname is the name of your PMDF system.
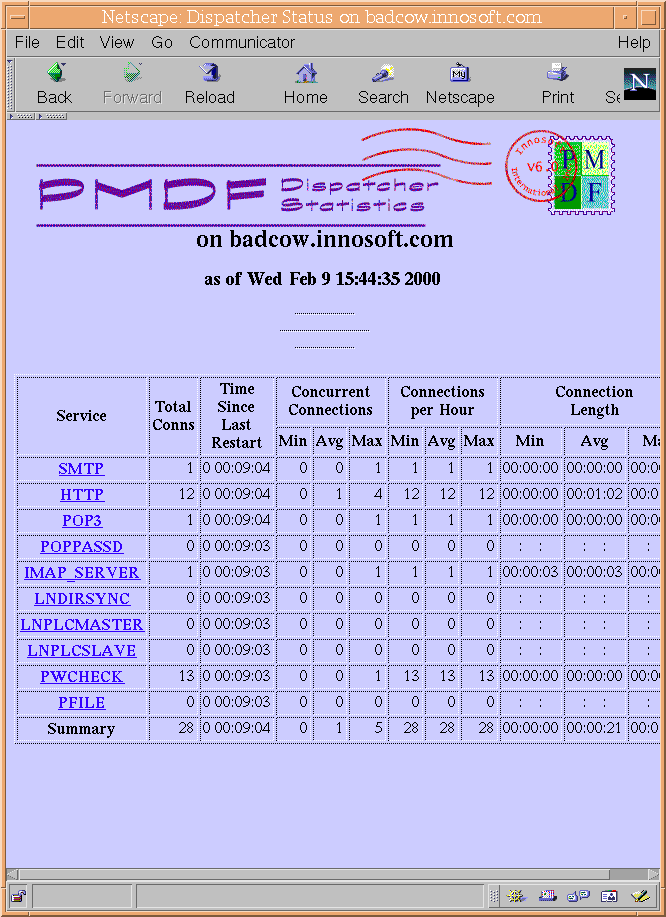
Figure 11-5 shows an example of Dispatcher statistics display on a
sample system.
Figure 11-5 Dispatcher statistics page
Note that since the Dispatcher statistics include detailed information regarding what connections were made to your system, it may not be appropriate to make this information publically available. Just what access permitted is controlled using an HTTP_ACCESS mapping table. Another example access mapping is shown here:
HTTP_ACCESS

  *|*|*|*|GET|/dispatcher/              $Y
  127.0.0.1|*|*|*|GET|/dispatcher/*     $Y
  *|*|*|*|GET|/dispatcher/*             $N
This will permit anyone to retrieve general information about the Dispatcher statistics, but only the local system (127.0.0.1) will be permitted to get detailed information about individual processes or connections. You can add other IP addresses, such as your workstation from which you run your browser, to this table.